


An imperfect understanding of where wickets come from
KL Rahul is modern cricket’s most perfectly flawed player.

KL Rahul is a great batter. He’s almost generational for all that he’s done, having played international cricket for 11 years now. There have been more than a fair share of instances where most of us myself included, have tagged him as the next big thing, one to look out for, what have you. And none of that’s lacked substance to it, for the most part.
KL is an amazing ODI bat. An easy incumbent for any debate around the best wicket-keeper bat in ODIs and would walk out winning most of them. His T20 journey has been, well tipsy-turvy, to say the least, but he has managed to make the best out of it more often than not. And then there’s his test career.
KL has been supreme at test cricket, while having stayed a bitter disappointment this whole while. You look at him and you can’t even mistakenly take him to be a batter who averages 34 in the format. And its not just the way he plays, the shoo-shah around how classy he is, but there are some very impressive numbers that back him as an effective test bat. The man has 9 centuries in Test cricket, with 8 of them overseas. I don’t remember what Rahane’s record was, but this is pretty good too.
And for the most part KL looks suited for Test cricket. He has the basics right about reading different lengths, controlling his tempo as dynamic as it may be, a darn impressive leave that I find only short of Williamson’s, but he still averages 34. Jarrod did a piece almost 2 years back around how the number 34 has stuck to him and two years since, seemingly nothing has changed. It is just bewildering that he isn’t able to score runs consistently. That he gets out after every 34 runs. He seems, but maybe only seems.
So, I decided to give it a shot. Look through his test numbers to see what’s what, who’s who, and the big how. How exactly does a 45-ish average ‘looking’ batter manage 34 runs per wicket. The data used for this study is confined to World Test Championship games starting from 2019, with KL’s last recorded game in the database as BGT’s 5th test in January this year.

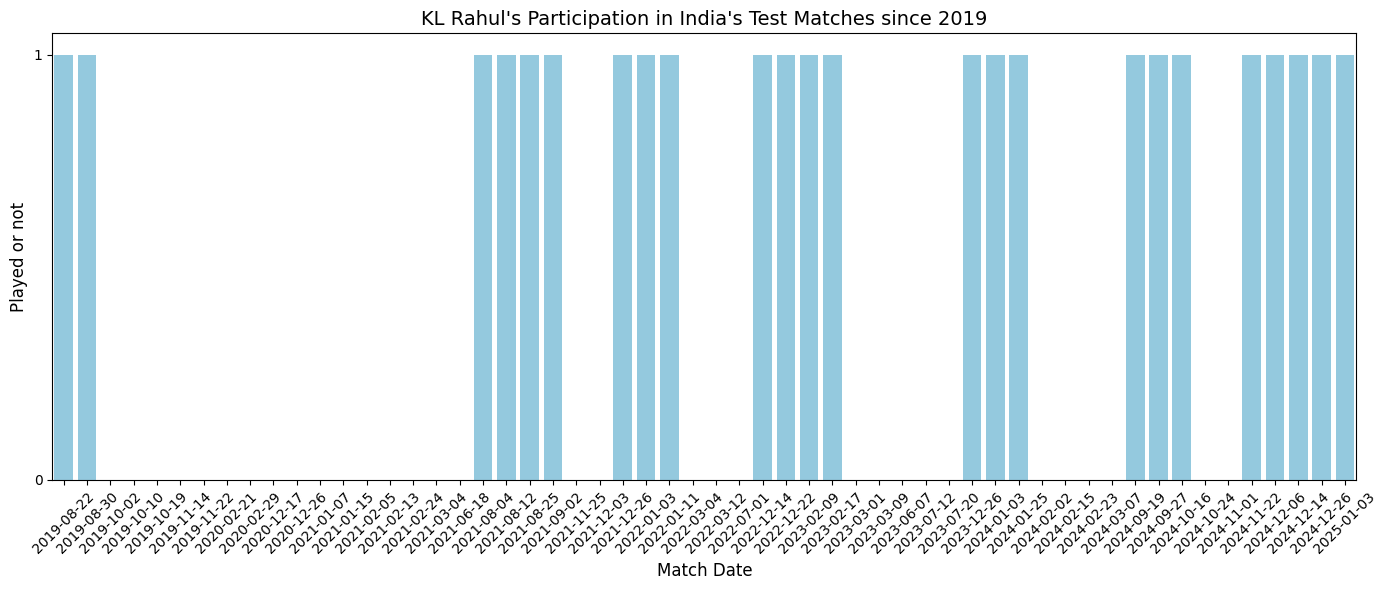
Here are KL’s batting numbers since the inception of the WTC, and right off the bat it’s very apparent that there haven’t been A LOT of tests that he has played. The test against West Indies in 2019, no fixtures in 2020, and a majority of the runs have come in the next 4 years with 2021 being his best time out since when he averaged a notch above 40 scoring more than 400 runs. That can be juxtaposed against the 2024 season where he averaged ~7 runs short per wicket. In the midst of all the chaos, an unarguably golden time for the Indian test team as a whole that saw them reach 2 out of the first 2 WTC finals, Rahul couldn’t find his footing in the XI, on account of a poor form, injuries, and sometimes both.

It’s very evident that KL hasn’t entirely been in the scheme of things for India across the WTC cycles.
And his lack of games has been rather consistent. KL has consistently missed games for India since 2019 without having played more than 4 fixtures in a row till Headingley a couple of weeks ago.
His infrequent presence in the test XI is annoyingly accompanied by him being shuffled in his batting position. While a majority of his runs have come with him playing as an opener, he’s been asked to make do with the occasional middle-order stint.

Since 2019, Rahul has averaged 30 runs per wicket as an opener. There’s no messing about that statistic; there isn’t an impact or relativity metric that can possibly salvage that. Barring 1 and 2, he has also been asked to bat at 3, 4, and 6 (the 2024 series against South Africa), and while the returns are convincingly better than him as an opener (a) there haven’t been enough games at those positions and (b) there’s no way he can now bat in any of those positions.

These are KL’s individual scores when he hasn’t opened the innings in the WTC era. His entry points have been all, all over the place and so have the scores, with the vast majority of it coming between the 12-month period of December ‘23 and December ‘24.
There’s also some conjecture about there being patterns in where his runs come from. Specifically, one that’s touted each time he does well which says that he scores tough runs, and that’s not quite true. Since 2019 in the 27 innings where the team totals have been less than 250, KL has average 22.9. Compare that to the 18 innings where the team’s total has exceeded 250, and his average jumps to 43.8.
KL fails to get a big score in test cricket more often than not, but that ctould be said about most batters. The cropper here is that he’s generally worse and almost everyone at getting going in test cricket.
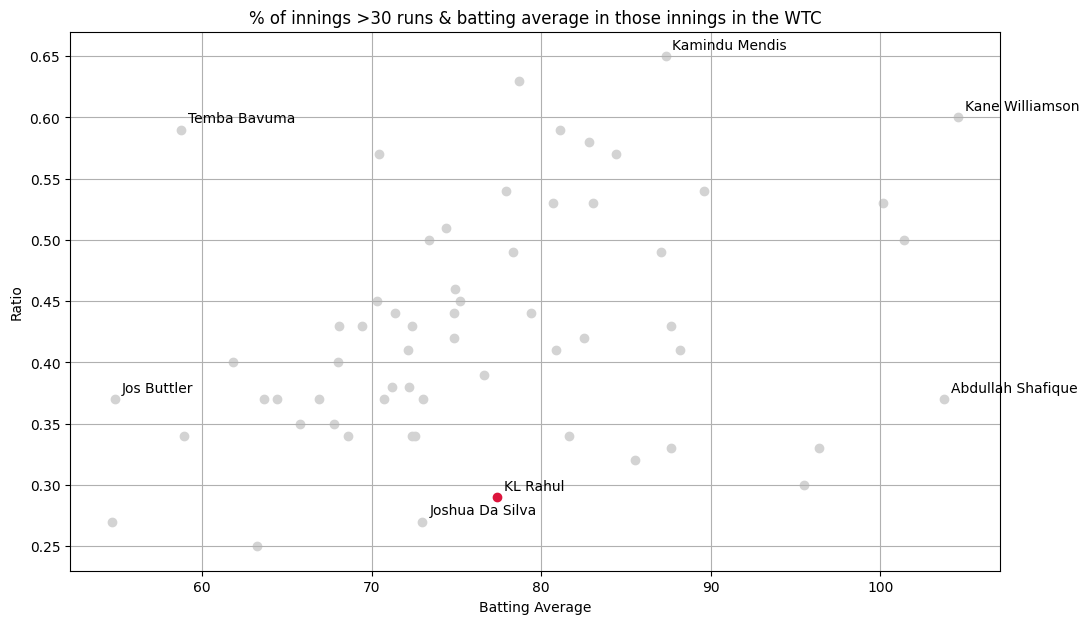
The graph above jots down the no. of times a batter goes past 30 runs in an innings, and how much they average once they do (a topic that sparked off after a twitter exchange with Rahul Iyer from Wisden).
KL has the 4th worst ratio of the no. of innings of more than 30 runs to total dismissal for all batters with more than 1,000 runs in the WTC, being only ahead of Najmul Shanto, Joshua Da Silva, and Ashwin (one of them, miserably, is not every a batter).
But while both he and Ollie Pope get to a score of 30 or above in almost 30% of their innings, the difference is where they’re able to take it from there on out. Pope averages 85 in those innings where he has scored above 30, while KL averages 77.
I think we can now step away from the kerfuffle and the mess that KL’s test career and its myriad of what-ifs and could-haves are and focus on how well he bats in the format. For a batter that exudes so much class and technical proficiency, KL seemingly has nothing and everything as a weakness.

Almost 60% of all the deliveries KL faces come out of the hands of a right-arm quick (this is a blanket category that would include everyone from Anderson to Hazlewood to Lungi Ngidi, what have you), and he averages what…he almost normally averages which is 37. The second and third most bowled options against him is left-arm pace and slow-left arm spinners, which is almost the pattern you’d seen across all right-handed batters in test cricket…almost. For instance, here are the splits for Kohli, Root, Smith and Williamson

What’s notable here is that ~16% of all deliveries bowled at KL have come off the hands of left-arm pacers. That number ranges between 3-5% for Root, Smith and Williamson and a notch above 10% for Kohli, and he isn’t particularly good against them either.
Basis balls where ball-tracking data is available, KL averages a measly 9.2 across 166 deliveries against left-arm pacers that are bowled outside the off-stump. KL has a massive problem against deliveries that are bowled across to him from the left-armers. Kohli, who is (I’m sorry, was) well known to have been troubled against the left-arm pacers too, averaged 31.2 against deliveries bowled outside off-stump.
KL, however, much prefers the balls lined outside the off-stump from right-arm pacers, the kinda bowlers against whom his infamous close-to-body style of leaving the ball have gained numerous eyeballs over the last few years, averaging 44.3 against them on that line.
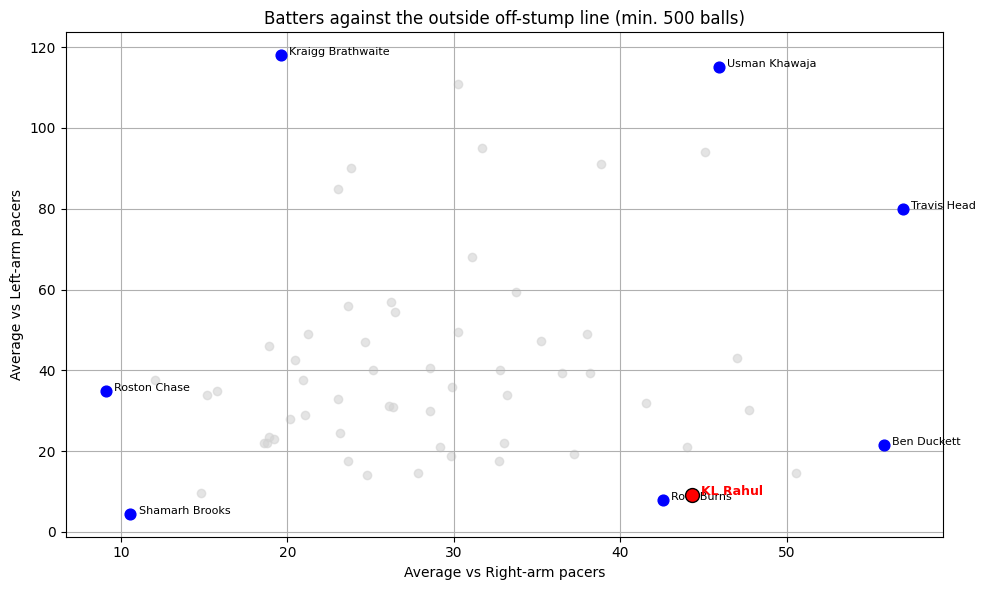
Among all the batters having played a minimum of 500 deliveries on the outside off-stump line, KL Rahul’s numbers border with…Rory Burns. That’s not a good name to be clubbed with.

In as vague a definition as may be possible; I describe the channel length out of a pacer’s hand to be bowled at a good length either at the stumps or outside the off-stump. Barring your yorkers, it is the line batters are the most vulnerable to (averaging 18.9 in the WTC), so it’s largely considered a good litmus test for a batter’s overall test acumen.
What’s on show here is that KL is…bang in the middle. Since 2019 he averages more against the attacking channel length than Kohli and Smith and just a smidge below Rohit. At the same time, his average is below not just guys like Root and Head, but Rahim and Chandimal too. So, this is obviously not an all-encompassing metric.
Important to not neglect the role control plays in this and in reflecting how lucky a batter is with their dismissals. Jotted below are batting averages against the control % exercised by batters against the channel length.

The graph tells us just how crucial a role luck plays in this sport. Pujara has a similar false shot % (15.7) to Nicolls (15.8), whereas the former averaged 10.4 against the pace bowler’s channel length, while the latter clocked 44.2 runs per wicket.
And where KL stands is again, bang in the middle. He has other batters cluttered around him almost too neatly, making him stand out ever so differently.
One thing that KL does get right, every chance he gets to, is his tempo. The rate at which he scores, accelerates through the innings. The pitfall here, again, is him getting to the point where that tempo management could mean something.

KL is a slower starter compared to the average top-6 batter and only goes past him after the first 30 overs. KL has lost his wicket 63.4% of the time within the first 30 overs of the innings. The average top 7 batter loses their wicket in the first 30 overs 46% of the time and 43% for Indian batters since 2019.

So, have I dissected what causes KL’s uneven returns in Test cricket? Am I stuck at the point where I started this? Yeah, probably. These charts aren’t going to make his cover drives any less magnificent, nor will they fix his game against the wider release point, so that’s that.